Covington Shares 2026 Outlook
Reprinted with the permission of author Sherry Bunting and Farmshine.
When retired Southeast Milk CEO Calvin Covington spoke at the Georgia Dairy Conference in Savannah in January, he wanted producers to walk away with three things: a clearer understanding of how federal order changes are actually affecting the Southeast, what regional supply-and-demand trends look like, and what all of that means for milk prices in 2026.
The forecast drew the most attention. Covington offered a cautious view, projecting combined statistical uniform (blend) prices for the three southeastern orders to average above $20 per cwt in 2026.
At $20.68, based on data available Jan. 19, that would exceed the 2021 average for the region but fall short of the stronger averages seen from 2022 through 2025.
More important than the headline number, Covington said later in a Farmshine phone interview, is understanding how the new federal order pricing changes are flowing through producer milk checks.
On the increased Class I differentials, he noted the numbers that are quoted, including by USDA, “are calculated at the base zone. That’s not what producers actually get paid.”
‘Effective’ Impact
One of the biggest misconceptions, Covington said, is assuming the increase in the Class I differentials at an order’s base-zones translates across that order.
“I wanted to look at the effective impact — the true number,” he said. “So, I went back and did the pool analysis.”
Using the Appalachian order as an example, he noted that while the Charlotte base-zone Class I differential increase is $2.20, the net effective increase across the order was closer to $1.82 once location adjustments are included.
More stable price
Covington emphasized how much of the Class I price is now effectively “fixed.”
Using Atlanta as an example, he showed that when the increased Class I differentials, transportation credits, and delivery credits are combined, about 31% of the Class I price is fixed, somewhat insulating it from day-to-day swings in commodity markets.
“That’s a little bit of ‘decoupling’ of Class I from manufacturing prices,” he said. “In a market that’s 70% to 80% Class I, that’s meaningful, and it’s positive.”
The percentage will fluctuate, so the region is still exposed to volatility, he observed, but the structure provides more downside stability when commodity prices fall.
Net gains so far
Looking at June through December 2025, Covington estimated average net gains of 77¢ per cwt in the Appalachian order, 35¢ in Florida, and 36¢ in the Southeast from federal order changes.
December stood out, he said, because the higher skim-solids composition (implemented in Dec.) and the “higher of” formula (implemented in June) both boosted the Class I price that month. He estimated the new skim factors alone added roughly 35 to 40¢ per cwt to the Class I price.
National picture
One number Covington said only became clear after implementation. That was the true national impact of the Class I differential changes.
“It wasn’t nearly as bad for fluid processors as some made it sound in the hearing,” he said.
He calculated the weighted-average effective Class I differential increase at about $1.24 per cwt across all 11 federal orders. Larger make allowances offset much of that by lowering regulated manufacturing prices, reducing Class II and IV prices by about 93¢ per cwt and Class III by roughly $1.01.
“You’ve got to remember those higher make allowances are also in the Class I base price. That $1.24 doesn’t sit there by itself,” Covington said. “Listening to testimony at the hearing, you’d think the world was ending (for fluid processors). It didn’t work out that way.”
Components and plant economics
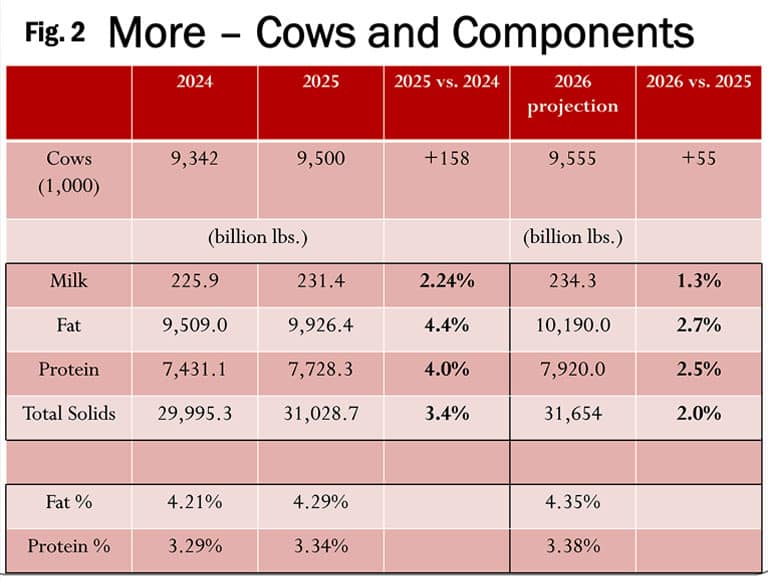
Component output continues to outpace milk production. Covington’s estimates showed 2025 milk pounds up a net 2.24% year-on-year (YoY), while butterfat pounds were up 4.4% and protein pounds up 4%. (Fig. 2)
 That directly affects plant efficiency. “A cheese plant producing a million pounds of cheese a day can take in 20 fewer loads of milk than it used to,” he said.
For plants taking in 10 million pounds of milk a day, which is not uncommon, Covington estimated the increase in make allowances reduce regulated milk costs by roughly $100,000 per day, which is a meaningful contribution toward expansion.
Still, he cautioned farmers against assuming all processing growth translates into stronger farm-level demand. “I’m all for more plants,” he said, “but will it end up in the dairy farmer’s pocket?”
Protein, whole milk, and white gallons
Covington also flagged a largely overlooked trend: rising natural protein in fluid milk.
An eight-ounce serving of whole milk now averages about 8 grams of total protein, up from 7.3 grams in 2000. “This is significant, 10% more protein in a glass of milk,” he said. “Yet we don’t talk about it.”
He sees the return of whole milk in schools as another potential demand lever. Noting the average fat percentage in packaged fluid milk sales has increased from 2.03% in 2010 to 2.52% in 2025 in the Southeast order, he said that, “Further increases absorb meaningful amounts of butterfat and can require more farm milk to hit a rising average.”
That ties into a broader frustration with promotion.
“Whether we like it or not, the vast majority of milk we sell is still gallons of white milk. We’ve never met that volume with anything else,” he said, adding that the industry keeps trying to take it apart, “even though milk is already nature’s most nearly perfect food.”
Southeast supply and demand
Despite strong Class I utilization percentages, Covington said the Southeast keeps losing Class I fluid volume. “In 2025 versus 2024, we dropped seven loads of Class I producer milk a day,” he reported. “Compared to 2021, we’re down 34 loads a day. It just keeps eating away.”
Because the split between milk processed inside the Southeast and packaged milk coming from outside has remained roughly 90% to 10% over the past five years, Covington sees the decline in Class I producer milk loads being driven by falling overall sales.
One modest bright spot: Class II milk “used to produce” has been creeping higher. “It’s only about 50 loads a day,” he said, “but that’s up three loads from the previous year,” reflecting growth in yogurt, cottage cheese and ice cream.
On the supply side, milk growth is concentrated in south Georgia and north Florida. The two states now account for 52% of the region’s milk supply, up from 39% in 2010.
“That milk’s going to be limited going south,” he said. “More often it moves west or north. What the federal order changes have done is flatten prices across the Southeast.”
This has shifted hauling incentives. “There’s more economic incentive now to leave milk in Georgia, North Carolina or South Carolina than to haul it all the way into Florida,” Covington said.
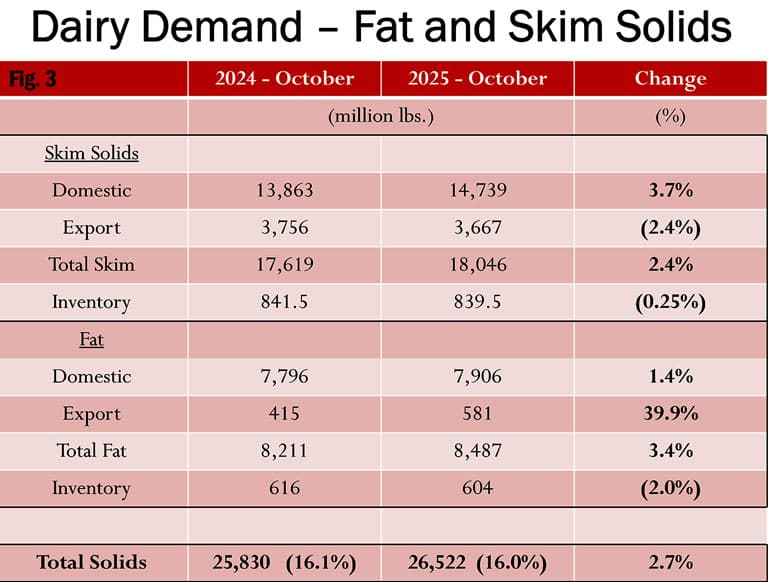 Demand on fat/skim basis
Covington urged producers to think about demand on a fat-and-skim basis rather than raw milk volume (Fig. 3).
In 2025, total fat-basis demand rose 3.4%, with domestic use up 1.4% and exports surging nearly 40%, while fat-basis inventories fell 2% YoY. On a skim-solids basis, total demand rose 2.4%, mainly on stronger domestic use, with inventories essentially flat.
Beef’s big role
While Covington’s Southeast outlook shows a roughly $2 drop in average blend prices from $22.58 in 2025 to $20.68 in 2026, and while USDA is forecasting a $2.90 drop in the 2026 national all-milk price average from $21.15 in 2025 to $18.25 in 2026, he said beef markets are providing a meaningful offset.
“Beef value (for calves and cull cows) is adding $3 to $4 per cwt (equivalent) to the price of milk,” he said.
That’s changing herd decisions. “If a Holstein cow is below average, but she breeds back, doesn’t cause problems, and you can sell her calf for $1,000, I’m probably going to keep her,” he said. “We’ve never had this dynamic before.”
Asked how that squares with USDA reporting continued gains in milk output per cow, Covington didn’t hesitate: “Farmers are doing a better job all around.” He cited genomics, sexed semen, better feeding and management, and professional calf growers whose numbers may not be fully captured.